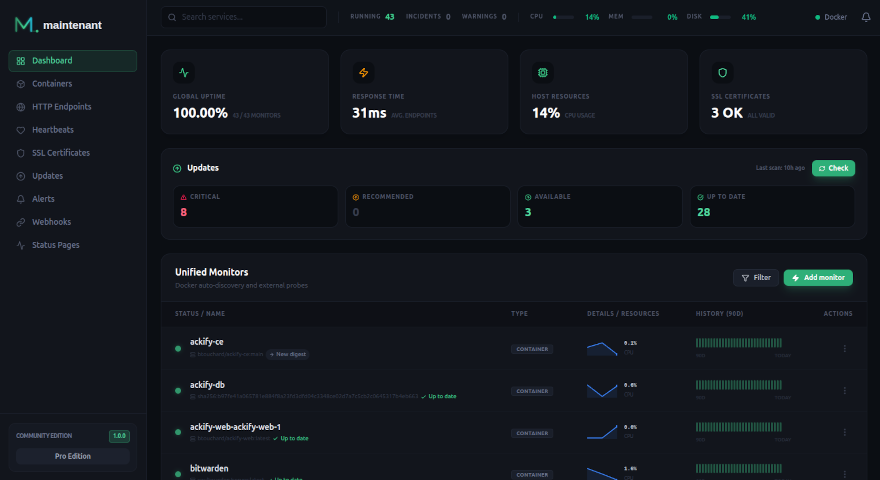
You're juggling 5 tools.
Or worse, you have nothing.
Uptime Kuma for HTTP, Healthchecks for crons, Grafana+Prometheus for metrics, an SSL checker, and bash scripts. None of them see the full picture.
Before — fragmented monitoring
- ✕ Uptime Kuma — HTTP checks only
- ✕ Healthchecks.io — heartbeats only
- ✕ Grafana + Prometheus + cAdvisor — 3 containers
- ✕ Separate SSL checker
- ✕ No unified view
- ✕ 5 dashboards, 5 configs, 5 maintenances
After — Maintenant
- ✓ Auto-discovered containers (Docker + K8s)
- ✓ HTTP/TCP endpoints monitored
- ✓ Cron jobs and heartbeats tracked
- ✓ SSL certificates validated automatically
- ✓ CPU, RAM, network, disk metrics
- ✓ One container. One dashboard. Everything's here.
Everything you need.
Nothing more.
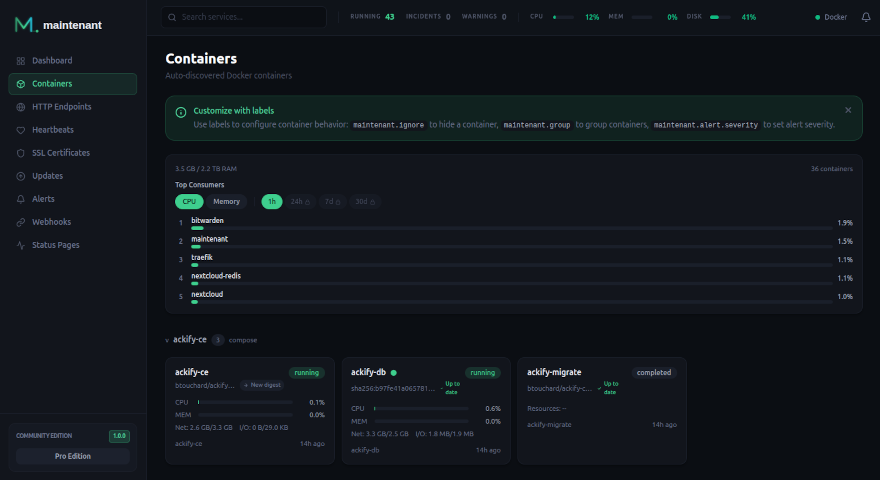
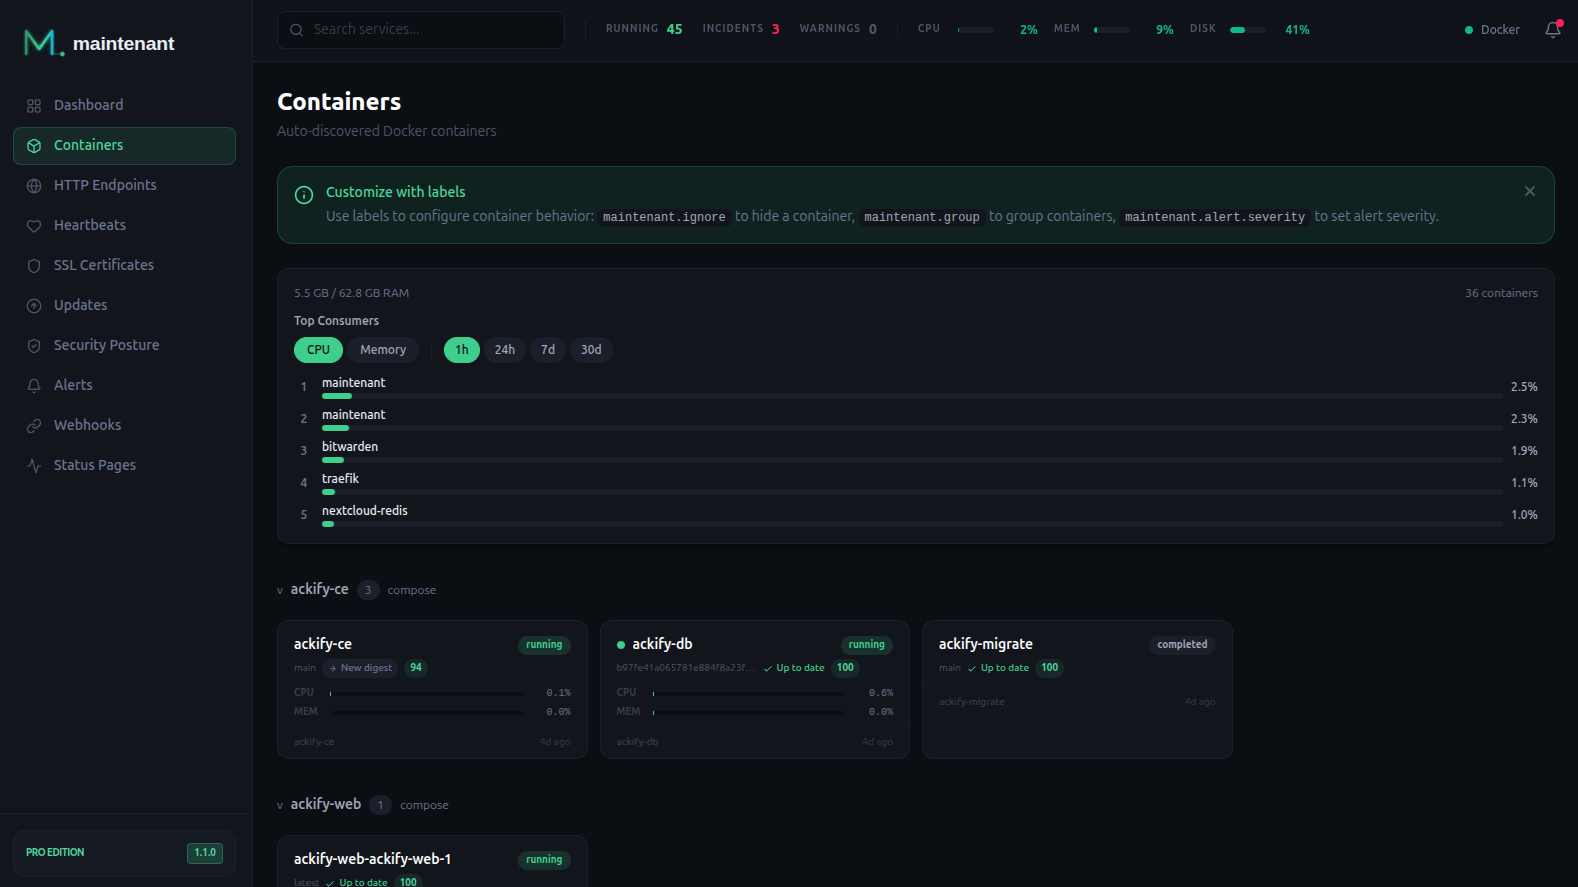
Containers
Docker and Kubernetes auto-discovery. States, health checks, restart loops, logs. Compose projects grouped automatically.
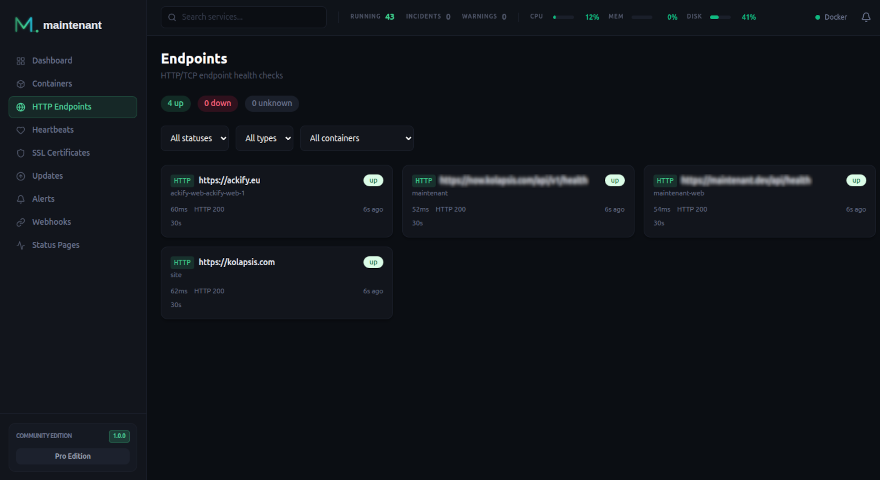
HTTP/TCP Endpoints
Active probing with latency, status codes, content assertions. Configure via Docker labels — zero YAML files.
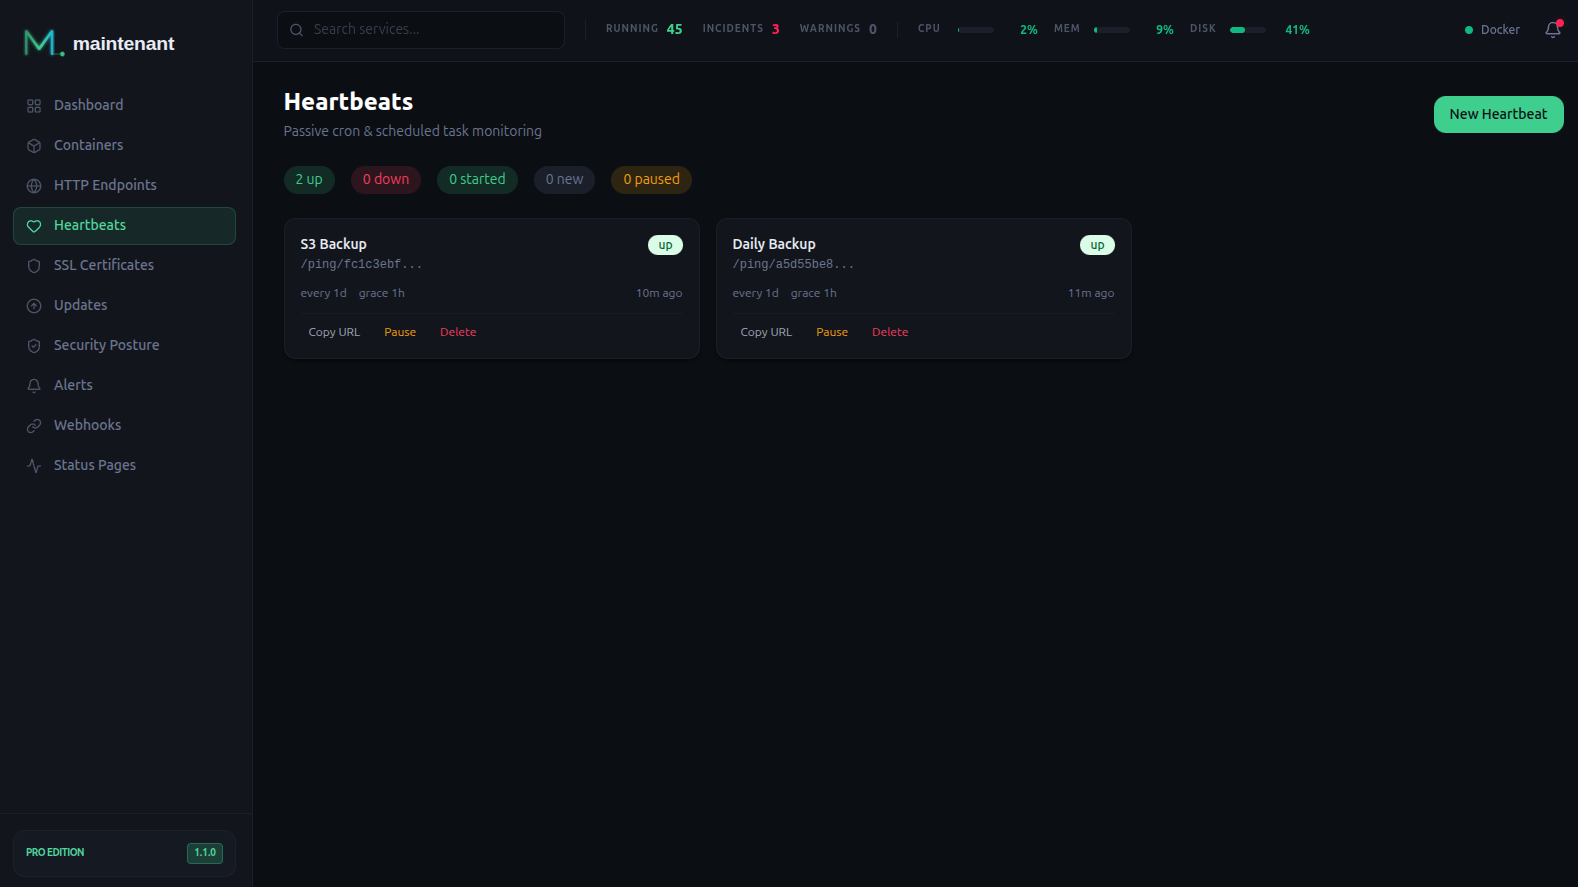
Heartbeats / Cron
Unique ping URL per job. Track durations, exit codes, and get alerted when a cron doesn't run.
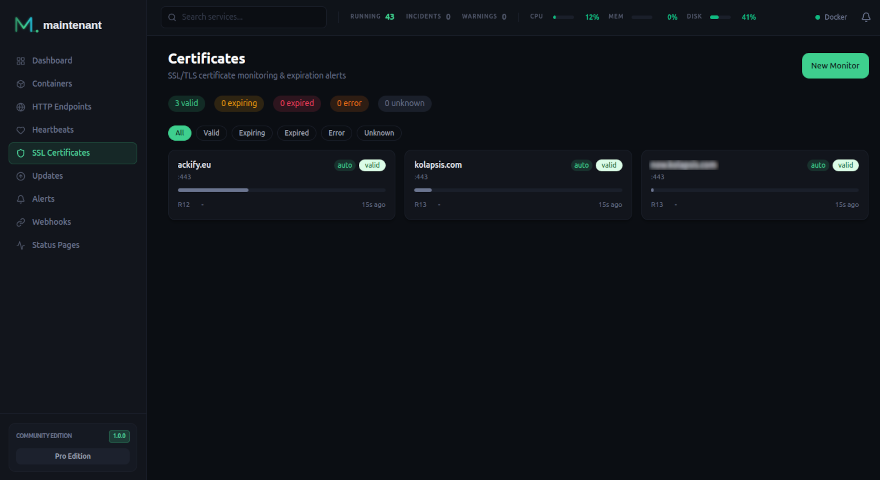
SSL/TLS Certificates
Automatic detection on your HTTPS endpoints. Expiration alerts at 30, 14, 7, 3, 1 day. Full chain validation.
System Resources
CPU, RAM, network and disk I/O — per container and per host. Real-time charts with configurable threshold alerts.
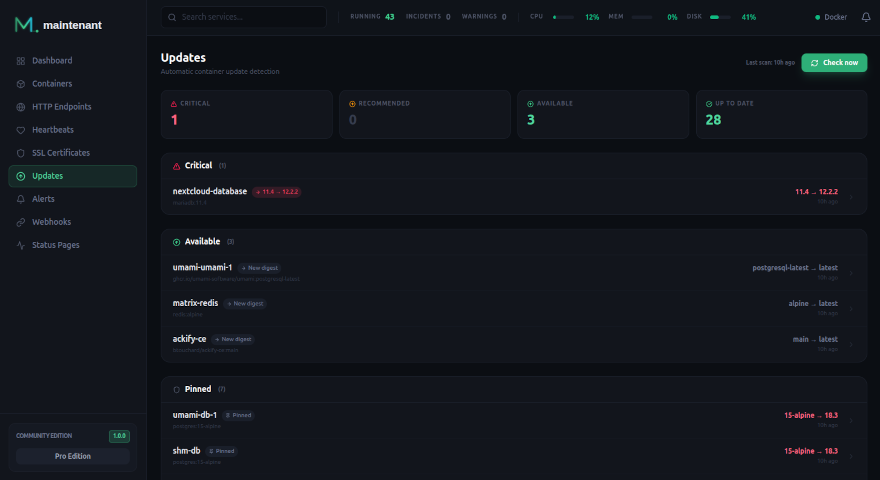
Update Intelligence
Detects available updates via OCI scan. Compare digests across all your containers. Stop blind docker pull.
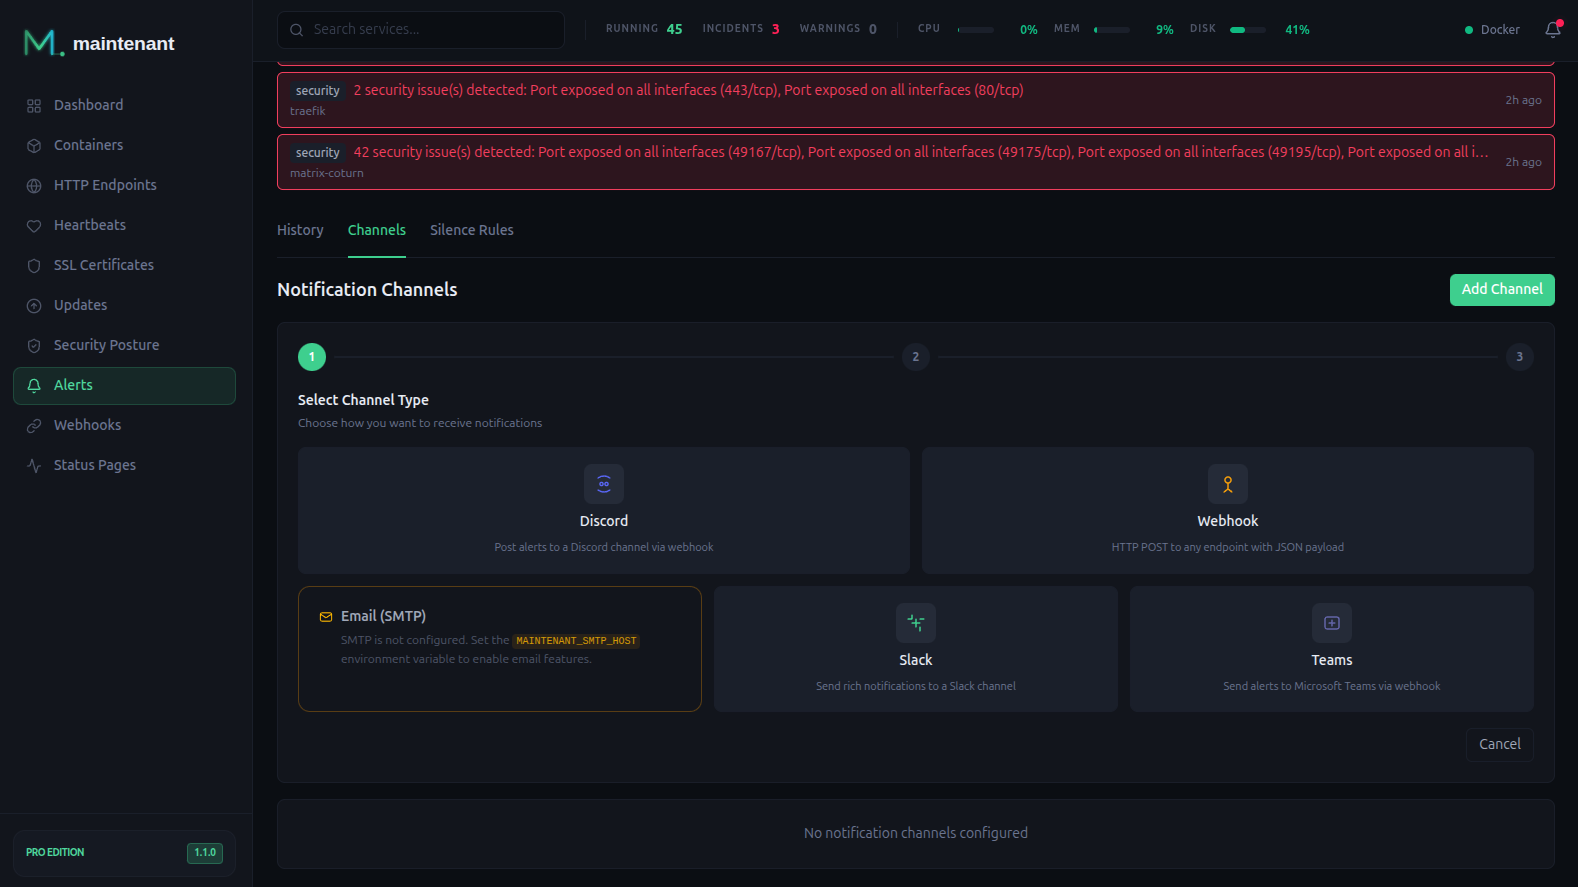
Unified Alerts
Webhook and Discord built-in. Pro Slack, Teams, Email, escalation, routing, and custom templates.
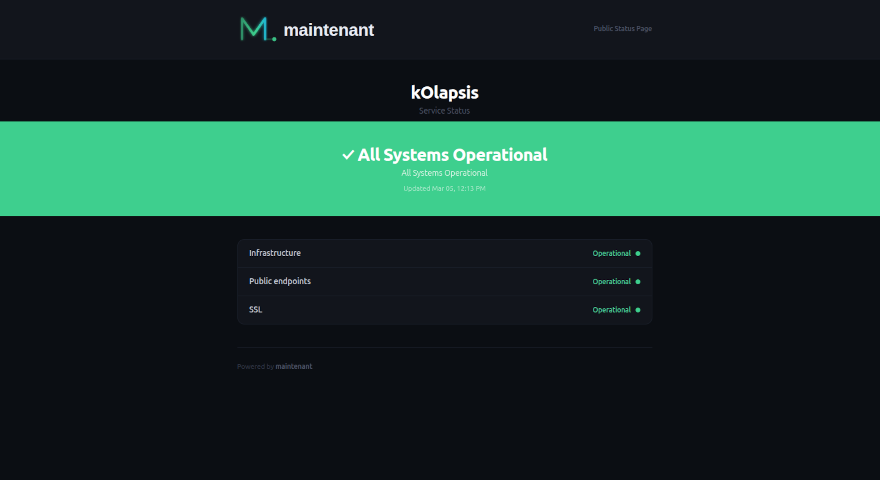
Status Page
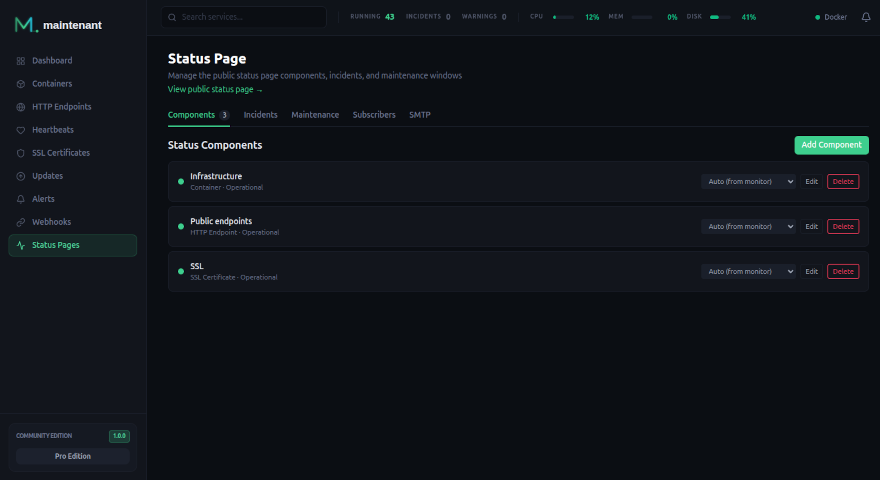
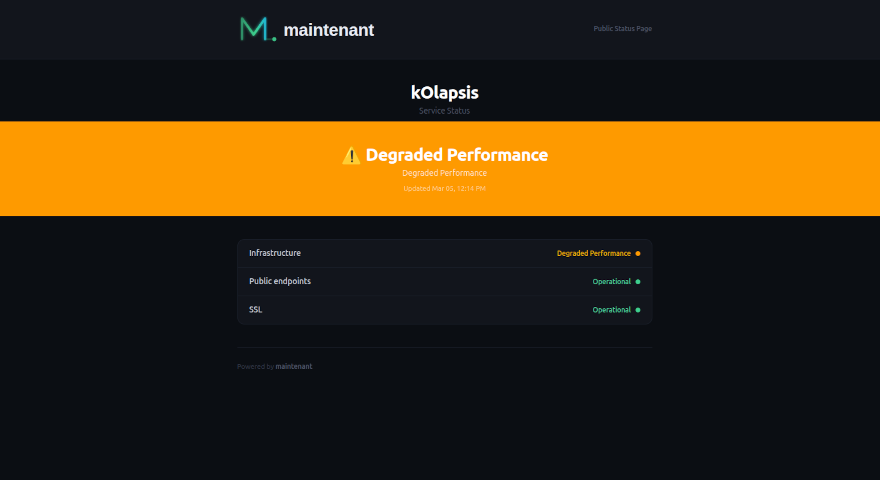
Real-time public page for your users. Component groups, live SSE updates. Pro Incident management, maintenance windows, subscriber notifications.
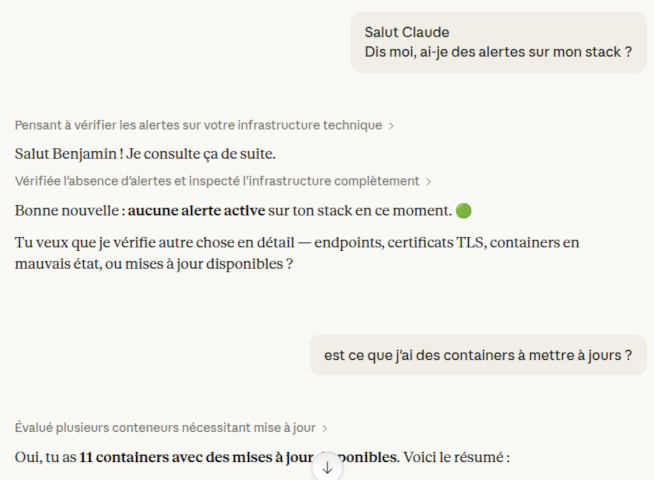
REST API + MCP
Full API under /api/v1/. Real-time SSE streams. Built-in MCP server to query your infra from an AI assistant.
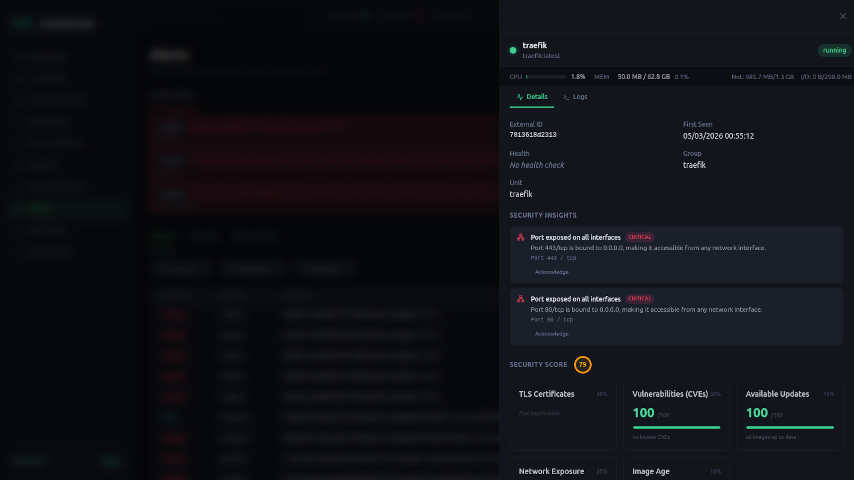
Network Security Insights
Detect open ports, exposed services, and unencrypted endpoints across your stack. Get actionable findings without external scanners.
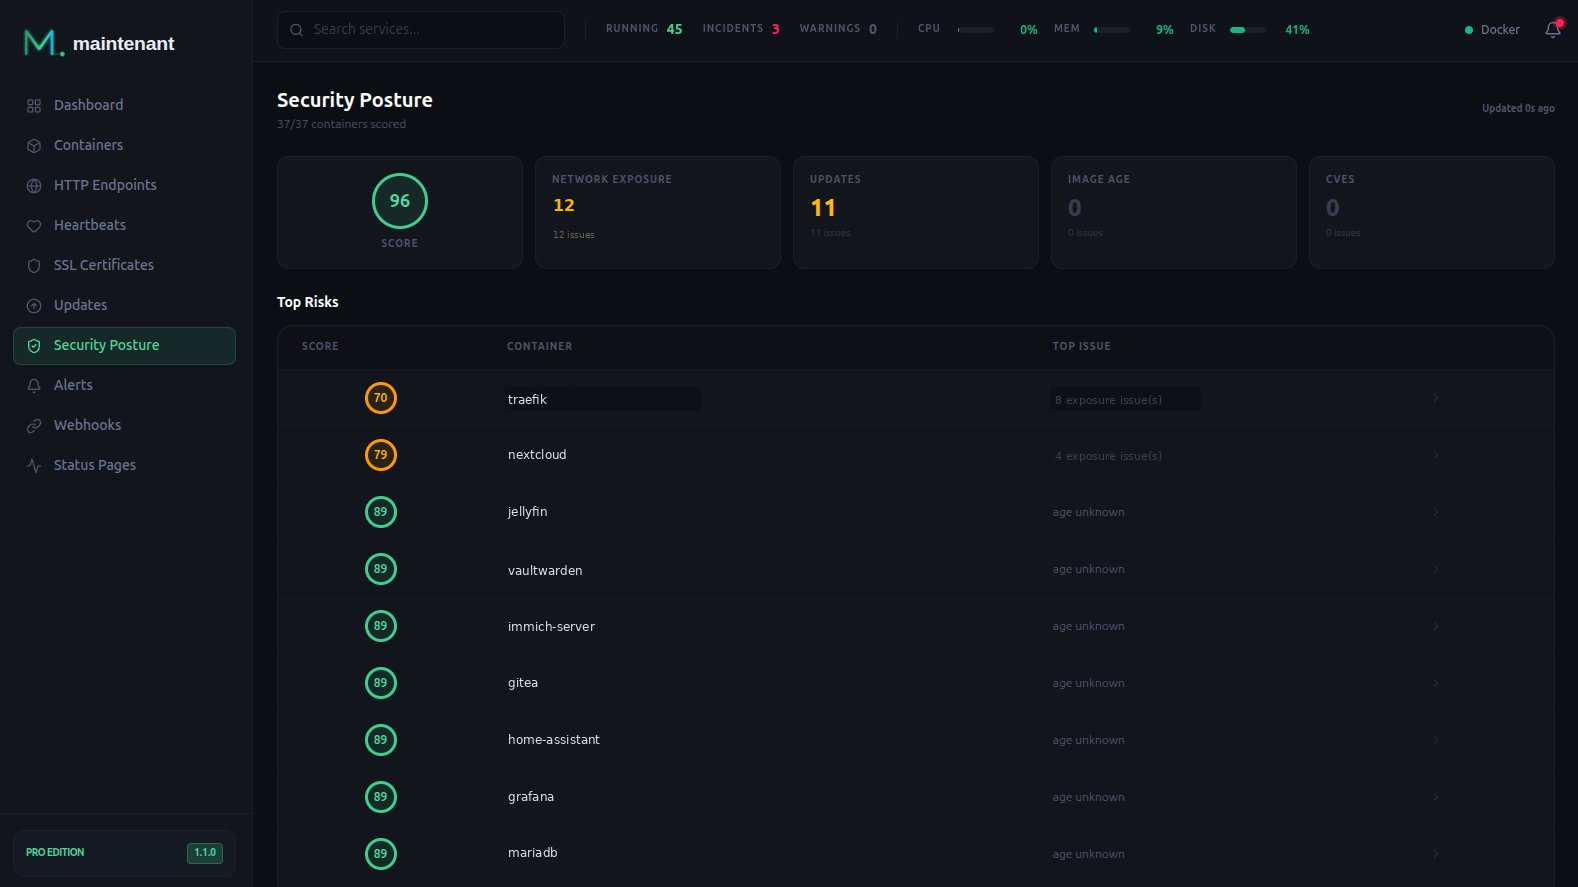
Unified Security Posture
Pro Consolidated security view combining CVEs, exposed ports, certificate issues, and misconfigurations. Risk scoring and remediation priorities.
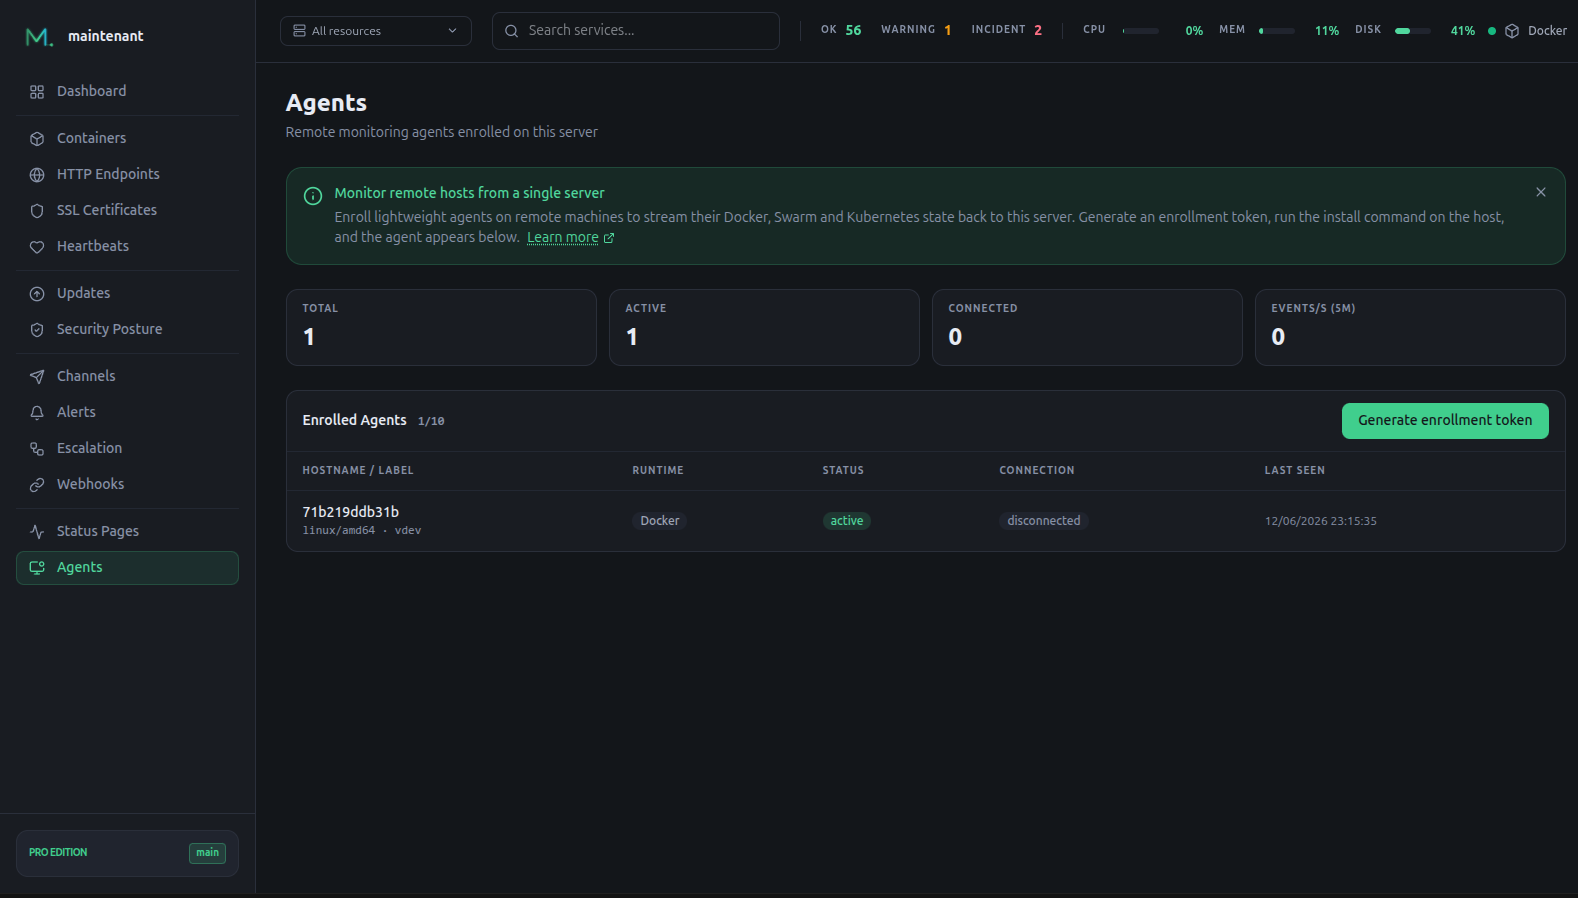
Multi-Server Agents
Pro Deploy lightweight agents on remote hosts to stream their Docker, Swarm and Kubernetes state back to one central server. Enroll with a single token — watch your whole fleet from a single pane.
Operational in 30 seconds
Deploy
Add Maintenant to your docker-compose.yml. Mount the Docker socket read-only. That's it.
docker compose up -dAuto-discovery
Maintenant detects your containers, their health checks, Compose projects. On Kubernetes, it detects the runtime automatically.
5 containers discoveredMonitor and alert
Add Docker labels for HTTP/TCP endpoints. Configure your Discord or Slack webhooks. Your stack is under control.
0 incidents · 99.98% uptimeCopy. Paste. Monitor.
# docker-compose.yml
services:
  maintenant:
    image: ghcr.io/kolapsis/maintenant:latest
    ports:
      - "8080:8080"
    volumes:
      - /var/run/docker.sock:/var/run/docker.sock:ro
      - /proc:/host/proc:ro
      - maintenant-data:/data
    environment:
      MAINTENANT_ADDR: "0.0.0.0:8080"
      MAINTENANT_DB: "/data/maintenant.db"
    restart: unless-stopped
volumes:
  maintenant-data:
Compatible with Docker Engine 20.10+ and Kubernetes · Linux amd64/arm64 · macOS · WSL2
One tool instead of five
| Maintenant | Uptime Kuma | Grafana Stack | Healthchecks | Portainer | |
|---|---|---|---|---|---|
| Container auto-discovery | ✓ | — | — | — | ✓ |
| HTTP/TCP Checks | ✓ | ✓ | ✓ | — | — |
| Heartbeats / Cron | ✓ | ✓ | — | ✓ | — |
| SSL Monitoring | ✓ | ✓ | — | — | — |
| CPU/RAM/Network metrics | ✓ | — | ✓ | — | Limited |
| Update detection | ✓ | — | — | — | ✓ |
| Public status page | ✓ | ✓ | — | — | — |
| Native Kubernetes | ✓ | — | ✓ | — | ✓ |
| Multi-server monitoring | ✓ | Limited | ✓ | — | ✓ |
| Network security insights | ✓ | — | — | — | — |
| Single binary, zero deps | ✓ | Node.js | 3+ containers | Python | — |
Simple. Transparent.
100% on-premise. Your data stays with you. Always.
Community Free forever Open source · AGPL-3.0 Install for free | Pro 29 €/month
14-day free trial included Start free trial
| |
|---|---|---|
| Monitoring | ||
| Container auto-discovery (Docker + K8s) | ✓ Unlimited | ✓ Unlimited |
| HTTP / TCP endpoint checks | 10 max | ✓ Unlimited |
| Heartbeats / cron | 5 max | ✓ Unlimited |
| SSL/TLS certificate monitors | 5 max | ✓ Unlimited |
| CPU · RAM · network · disk metrics | ✓ | ✓ |
| Metrics history retention | 1h + 6h | up to 30 days |
| Update Intelligence (digest scan) | ✓ | ✓ |
| OCSP stapling (cert revocation) | — | ✓ |
| Alerting | ||
| Alert engine + routing (severity / source) | ✓ | ✓ |
| Webhook + Discord | ✓ | ✓ |
| Slack · Teams · Email | — | ✓ |
| Advanced trigger filters (scopes / tags) | — | ✓ |
| Escalation policies | — | ✓ |
| Maintenance windows | — | ✓ |
| Status pages | ||
| Public status page (live SSE) | ✓ | ✓ |
| Status page components | 3 max | ✓ Unlimited |
| Incident management + timeline | — | ✓ |
| Subscriber notifications | — | ✓ |
| Branding & personalization | — | ✓ |
| Security | ||
| Network Security Insights | ✓ | ✓ |
| CVE enrichment | — | ✓ |
| Risk scoring (per container) | — | ✓ |
| Changelog intelligence | — | ✓ |
| Unified Security Posture | — | ✓ |
| Multi-server & orchestration | ||
| Multi-server monitoring (agent fleet) | — | ✓ up to 10 hosts |
| Swarm dashboard (nodes, rolling updates) | — | ✓ |
| Kubernetes cluster / node view | — | ✓ |
| Platform & API | ||
| REST API + SSE + MCP server | ✓ | ✓ |
| PWA | ✓ | ✓ |
| Priority email support | — | ✓ |
Install Maintenant, then activate Pro from the interface
Your stack deserves
to be monitored.
One container. Zero config. Install Maintenant and take back control.